Papers on changes in DLR
Posted by Ari Jokimäki on August 19, 2009
This list of papers contains evidence of changes in downward longwave radiation (DLR) caused by changing concentrations of greenhouse gases (GHG). The list is not complete, and will most likely be updated in the future in order to make it more thorough and more representative.
UPDATE (December 13, 2018): Feldman et al. (2018) added.
UPDATE (February 26, 2015): Feldman et al. (2015) added.
UPDATE (February 3, 2010): Allan (2000) and some links to GEBA added.
UPDATE (October 8, 2009): I replaced the link to Wang & Liang (2009). It was at the time of the writing of this list so new paper that it only appeared in a “papers in press” list, but now it has a proper link to abstract page (no PDF seems to be available for free, sorry).
Observationally derived rise in methane surface forcing mediated by water vapour trends – Feldman et al. (2018) [FULL TEXT]
Abstract: “Atmospheric methane (CH4) mixing ratios exhibited a plateau between 1995 and 2006 and have subsequently been increasing. While there are a number of competing explanations for the temporal evolution of this greenhouse gas, these prominent features in the temporal trajectory of atmospheric CH4 are expected to perturb the surface energy balance through radiative forcing, largely due to the infrared radiative absorption features of CH4. However, to date this has been determined strictly through radiative transfer calculations. Here, we present a quantified observation of the time series of clear-sky radiative forcing by CH4 at the surface from 2002 to 2012 at a single site derived from spectroscopic measurements along with line-by-line calculations using ancillary data. There was no significant trend in CH4 forcing between 2002 and 2006, but since then, the trend in forcing was 0.026 ± 0.006 (99.7% CI) W m2 yr−1. The seasonal-cycle amplitude and secular trends in observed forcing are influenced by a corresponding seasonal cycle and trend in atmospheric CH4. However, we find that we must account for the overlapping absorption effects of atmospheric water vapour (H2O) and CH4 to explain the observations fully. Thus, the determination of CH4 radiative forcing requires accurate observations of both the spatiotemporal distribution of CH4 and the vertically resolved trends in H2O.”
Citation: D. R. Feldman, W. D. Collins, S. C. Biraud, M. D. Risser, D. D. Turner, P. J. Gero, J. Tadić, D. Helmig, S. Xie, E. J. Mlawer, T. R Shippert & M. S. Torn, Nature Geosciencevolume 11, pages238–243 (2018), https://doi.org/10.1038/s41561-018-0085-9.
Observational determination of surface radiative forcing by CO2 from 2000 to 2010 – Feldman et al. (2015) [FULL TEXT]
Abstract: “The climatic impact of CO2 and other greenhouse gases is usually quantified in terms of radiative forcing, calculated as the difference between estimates of the Earth’s radiation field from pre-industrial and present-day concentrations of these gases. Radiative transfer models calculate that the increase in CO2 since 1750 corresponds to a global annual-mean radiative forcing at the tropopause of 1.82 ± 0.19 W m−2 (ref. 2). However, despite widespread scientific discussion and modelling of the climate impacts of well-mixed greenhouse gases, there is little direct observational evidence of the radiative impact of increasing atmospheric CO2. Here we present observationally based evidence of clear-sky CO2 surface radiative forcing that is directly attributable to the increase, between 2000 and 2010, of 22 parts per million atmospheric CO2. The time series of this forcing at the two locations—the Southern Great Plains and the North Slope of Alaska—are derived from Atmospheric Emitted Radiance Interferometer spectra together with ancillary measurements and thoroughly corroborated radiative transfer calculations. The time series both show statistically significant trends of 0.2 W m−2 per decade (with respective uncertainties of ±0.06 W m−2 per decade and ±0.07 W m−2 per decade) and have seasonal ranges of 0.1–0.2 W m−2. This is approximately ten per cent of the trend in downwelling longwave radiation. These results confirm theoretical predictions of the atmospheric greenhouse effect due to anthropogenic emissions, and provide empirical evidence of how rising CO2 levels, mediated by temporal variations due to photosynthesis and respiration, are affecting the surface energy balance.”
Citation: D. R. Feldman, W. D. Collins, P. J. Gero, M. S. Torn, E. J. Mlawer, & T. R. Shippert, Nature (2015) doi:10.1038/nature14240.
Global atmospheric downward longwave radiation over land surface under all-sky conditions from 1973 to 2008 – Wang & Liang (2009) [FULL TEXT]
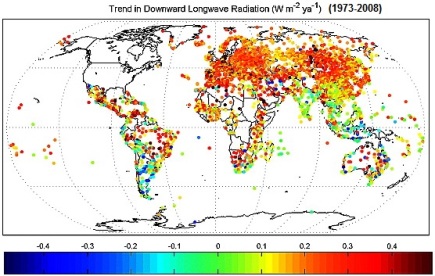
Abstract: “In this article, we first evaluate two widely accepted methods to estimate global atmospheric downward longwave radiation (Ld) under both clear and cloudy conditions, using meteorological observations from 1996 to 2007 at 36 globally distributed sites, operated by the Surface Radiation Budget Network (SURFRAD), AmeriFlux, and AsiaFlux Projects. The breakdown of locations is North America (20 sites), Asia (12 sites), Australia (2 sites), Africa (1 site), and Europe (1 site). Latitudes for these sites range from 0° at the equator to ±50°; elevation ranges from 98 to 4700 m, and six different land cover types are represented (deserts, semideserts, croplands, grasslands, forests, and wetlands). The evaluation shows that the instantaneous Ld under all-sky conditions is estimated with an average bias of 2 W m−2 (0.6%), an average standard deviation (SD) of 20 W m−2 (6%), and an average correlation coefficient (R) of 0.86. Daily Ld under all-sky conditions is estimated with a SD of 12 W m−2 (3.7%) and an average R of 0.93. These results suggest that these two methods could be applied to most of the Earth’s land surfaces. Accordingly, we applied them to globally available meteorological observations to estimate decadal variation in Ld. The decadal variations in global Ld under both clear and cloudy conditions at about 3200 stations from 1973 to 2008 are presented. We found that daily Ld increased at an average rate of 2.2 W m−2 per decade from 1973 to 2008. The rising trend results from increases in air temperature, atmospheric water vapor, and CO2 concentration.”
Citation: Wang, K., and S. Liang (2009), Global atmospheric downward longwave radiation over land surface under all-sky conditions from 1973 to 2008, J. Geophys. Res., 114, D19101, doi:10.1029/2009JD011800.
Combined surface solar brightening and increasing greenhouse effect support recent intensification of the global land-based hydrological cycle – Wild et al. (2008) [FULL TEXT]
Abstract: “The surface net radiation (surface radiation balance) is the key driver behind the global hydrological cycle. Here we present a first-order trend estimate for the 15-year period 1986–2000, which suggests that surface net radiation over land has rapidly increased by about 2 Wm−2 per decade, after several decades with no evidence for an increase. This recent increase is caused by increases in both downward solar radiation (due to a more transparent atmosphere) and downward thermal radiation (due to enhanced concentrations of atmospheric greenhouse-gases). The positive trend in surface net radiation is consistent with the observed increase in land precipitation (3.5 mmy−1 per decade between 1986 and 2000) and the associated intensification of the land-based hydrological cycle. The concurrent changes in surface net radiation and hydrological cycle were particularly pronounced in the recovery phase following the Mount Pinatubo volcanic eruption, but remain evident even when discarding the Pinatubo-affected years.”
Citation: Wild, M., J. Grieser, and C. Schär (2008), Combined surface solar brightening and increasing greenhouse effect support recent intensification of the global land-based hydrological cycle, Geophys. Res. Lett., 35, L17706, doi:10.1029/2008GL034842.
The climatological record of clear-sky longwave radiation at the Earth’s surface: evidence for water vapour feedback? – Prata (2008) “Here long-term (more than 25 years) mean monthly profiles obtained from globally distributed land-based radiosonde stations are subjected to detailed radiative transfer computations and Fourier time-series analysis. The results indicate that over the period 1964-1990, there has been a global increase in the clear-sky longwave flux at the surface. The global trend is approximately +1.7 W m-2 per decade, and there is a strong latitudinal pattern, with greater increases occurring in the tropics and smaller increases at both poles. There are also concomitant increases in precipitable water and the patterns appear to be highly correlated with increases in F↓. Increases in CO2 with time were not included in the calculations and it is estimated that the radiative impact of changes in CO2 on the F↓ trend is ∼20% per decade. A simple model of the dependence of surface air temperature and precipitable water on the downwards clear-sky flux supports the notion that both variables are contributing to increases in F↓. It is suggested that increases in precipitable water represent a positive feedback on F↓.”
Measurements of the Radiative Surface Forcing of Climate – Evans & Puckrin (2006) “A comparison between our measurements of surface forcing emission and measurements of radiative trapping absorption from the IMG satellite instrument shows reasonable agreement. The experimental fluxes are simulated well by the FASCOD3 radiation code. This code has been used to calculate the model predicted increase in surface radiative forcing since 1850 to be 2.55 W/m2. In comparison, an ensemble summary of our measurements indicates that an energy flux imbalance of 3.5 W/m2 has been created by anthropogenic emissions of greenhouse gases since 1850. This experimental data should effectively end the argument by skeptics that no experimental evidence exists for the connection between greenhouse gas increases in the atmosphere and global warming.” [Link to PDF]
Variability in clear-sky longwave radiative cooling of the atmosphere – Allan (2006) DLR is among the issues discussed in this paper, but it is measured only indirectly (very indirectly, actually, from measurements of column integrated water vapor and temperature measurements). [Link to PDF]
Comparison of clear-sky surface radiative fluxes simulated with radiative transfer models – Puckrin et al. (2004) “The surface fluxes of several important radiatively active gases, including H2O, CO2, CH4, N2O, O3, and the chlorofluorocarbons CFC11 and CFC12, were simulated with the radiation band models from the National Center for Atmospheric Research (NCAR) community climate model 3 (CCM3), the single-column community atmospheric model (SCAM), and the Canadian global climate model 3 (GCM3). These results were compared with the measured fluxes for a very cold winter day and with the simulated results for other standard atmospheres using the line-by-line radiative transfer model (LBLRTM). The comparison shows that the total surface radiative flux contributed by all the greenhouse gases combined is well simulated by the SCAM and GCM3 radiation band models.” [Link to PDF]
Radiative forcing – measured at Earth’s surface – corroborate the increasing greenhouse effect – Philipona et al. (2004) “Here we show that atmospheric longwave downward radiation significantly increased (+5.2(2.2) Wm-2) partly due to increased cloud amount (+1.0(2.8) Wm-2) over eight years of measurements at eight radiation stations distributed over the central Alps. … However, after subtracting for two thirds of temperature and humidity rises, the increase of cloud-free longwave downward radiation (+1.8(0.8) Wm-2) remains statistically significant and demonstrates radiative forcing due to an enhanced greenhouse effect.” [Link to PDF]
BSRN Longwave Downward Radiation Measurements Combined With GCMs Show Promise For Greenhouse Detection Studies – Wild & Ohmura (2004) Presents model simulations of DLR and some initial observational results. “First analyses of the available observational time series of LWD in the BSRN database show an overall increase over the past decade.” [Link to PDF]
The Surface Downward Longwave Radiation in the ECMWF Forecast System – Morcrette(2002) Compares model results of DLR to observations.
Downward longwave radiation in general circulation models: a case study at a semi‐arid continental site – Wild & Cechet (2002) Compares model results of DLR to observations.
Evaluation of Downward Longwave Radiation in General Circulation Models – Wild et al. (2001) Compares model results of DLR to observations.
Evaluation of Simulated Clear-Sky Longwave Radiation Using Ground-Based Observations – Allan (2000) “Surface observations from a tropical ocean and a subarctic land-based site are employed to evaluate the clear-sky surface downwelling longwave irradiance (SDL) simulated using the European Centre for Medium-Range Weather Forecasts reanalysis (ERA). Comparison of simulated clear-sky and observed all-sky SDL highlights coincident periods of irradiance variability on various timescales in both datasets.” [Link to PDF]
Longwave surface radiation over the globe from satellite data: An error analysis – Gupta et al. (1993) “Errors have been analysed for monthly-average downward and net longwave surface fluxes derived on a 5° equal-area grid over the globe using a satellite technique. … The errors in the TOVS-derived surface temperature, water vapour burden and cloud cover were estimated by comparing these meteorological parameters with independent measurements obtained from other satellite sources. Analysis of the overall errors shows that the present technique could lead to underestimation of downward fluxes by 5 to 15 Wm-2 and net fluxes by 4 to 12 Wm-2.”
Downward Longwave Irradiance at the Ocean Surface From Satellite Data: Methodology and in Situ Validation – Frouin et al. (1987) “The results indicate that the satellite methods perform similarly, with standard errors of estimate ranging from 21 to 27 W m−2 on a half-hourly time scale and from 16 to 22 W m−2 on a daily time scale. These errors correspond to 6 to 8% and 4 to 6% of the average measured values, respectively. When compared with techniques based on empirical formulas that employ conventional surface data, the satellite methods also exhibit similar standard errors of estimate. The satellite methods, however, are favored, since they are generally less biased and globally applicable.”
Estimation of daytime downward longwave radiation at the surface from satellite and grid point data – Schmetz et al. (1986) “A hybrid method is developed for the estimation of the daytime downward longwave radiation flux (DLF) at the surface. … The method is a first attempt to estimate the DLF at regional scales from satellite data on the cloud field and grid point analysis data on the thermodynamic field.”
Downward Longwave Radiation at the Surface from Satellite Measurements – Darnell et al. (1983) “A new technique is presented for generating downward longwave flux at the Earth’s surface from satellite meteorological data and a radiative transfer model The technique was tested by using TIROS-N data from 41 passes over a ground site covering a period of one month. Satellite-derived fluxes were compared with those measured by a ground-based pyrgeometer during each overpass. The standard error of the satellite-derived fluxes relative to the mean ground-measured values was found to be 6.5%.” [Link to PDF]
Closely related
Global Energy Balance Archive (GEBA) (“Proto-GEBA”), see also GCOS Switzerland GEBA page, especially this report.
Papers on atmospheric measurements of GHGs
Papers on changes in OLR due to GHG’s

Ari Jokimäki said
I added Allan (2000) and some links to GEBA.
Ari Jokimäki said
I added Feldman et al. (2015).
Toename van CO2 versterkt het broeikaseffect | Klimaatverandering said
[…] Een overzicht van diverse studies betreffende het naar de aarde teruggestraalde IR is te vinden op deze AGW Observer pagina:https://agwobserver.wordpress.com/2009/08/19/papers-on-changes-in-dlr/ […]